
May 07,2025
How to Use Microsoft Excel: A Beginner’s Tutorial
Microsoft Excel is a powerful spreadsheet application that allows users to organize, analyze, and visualize data. Whether you are a student, a professional, or just someone looking to manage personal finances, Excel can help you achieve your goals. In this tutorial, we will cover the basics of using Microsoft Excel, including how to create a new workbook, enter data, format cells, and perform calculations.
Microsoft Excel Tabs
Excel is organized into tabs, each containing a set of tools and features. The most commonly used tabs are:

1.Home Tab
Contains basic formatting options, such as font size, color, and alignment.
| Label | Function | Purpose |
|---|---|---|
| F | Past | Paste copied or cut content. |
| H | Cut,Copy,Format Painter | Basic clipboard operations. |
| P | Font Group | Change font, size, color, bold, italic, underline, etc. |
| M | Alignment Group | Align text, merge cells, wrap text. |
| A | Number Group | Format numbers (currency, %, decimals). |
| R | Conditional formatting | Format cells based on rules. |
| W | Format as Table, Cell Styles | Apply predefined styles or convert range into a table. |
| Y | Cells Group (Insert/Delete/Format) | Insert, delete or format rows/columns/sheets. |
| Z | Editing Group (AutoSum, Fill, Sort, Find) | Perform calculations, sort/filter data, find content |
2. Insert Tab
Allows you to add charts, tables, images, and other objects to your worksheet.
| Label | Function | Purpose |
|---|---|---|
| H | PivotTable | create summary reports from data |
| N | Table | Convert a range into an Excel table. |
| P | Illustrations (Pictures, Icons) | Add visuals like images, shapes, icons. |
| M | Chart | Insert charts: bar, line, pie, etc. |
| R | SmartArt,Screenshot | Add diagrams or capture screen |
| W | filter(Slicer,Timeline) | Filter data interactively in pivotTable |
| Y | Symbols(Equation,Symbol) | Insert special characters or equation |
3. Formulas Tab
Provides access to Excel's built-in functions and formula tools.
| Label | Function | Purpose |
|---|---|---|
| F | Insert Function | Open the function wizard |
| H | AutoSum | Quickly sum or average a range |
| N,P,M,A | Function library | Access financial, logical , text , date , math functions |
| R | Lookup & Reference | Use functions like VLOOKUP , HLOOKUP , INDEX , MATCH |
| W | Formula Auditing | Trace precedents, show errors, evaluate formulas. |
| Y | Name Manager , Create from selection | Manage named ranges |
4. Data Tab
Used for importing, exporting, and managing data connections.
| Label | Function | Purpose |
|---|---|---|
| F | Get Data | Import data from files, databases, web, etc. |
| H, N, P | From Text/CSV, From Web, Existing Connections | Connect to external data sources |
| M | Refresh All | Updata data from connected sources. |
| A | Queries & Connections | View and mange data queries |
| Z | Sort & Filter | organize data using filters or sort tools |
| Y | Advanced Filter | Apply more complex filter criteria |
| L | Data Tools(Text to columns,flash fill, etc.) | Split text, fill patterns, validate data |
| T | Forecast Group | Create forecast sheets and perform tend analysis |
| V | Group/Ungroup | Outline data by grouping rows or columns |
Microsoft Excel using for Data Analysis
Excel is a powerful tool for data analysis, allowing users to perform complex calculations, create charts, and analyze trends. Here are some key features:
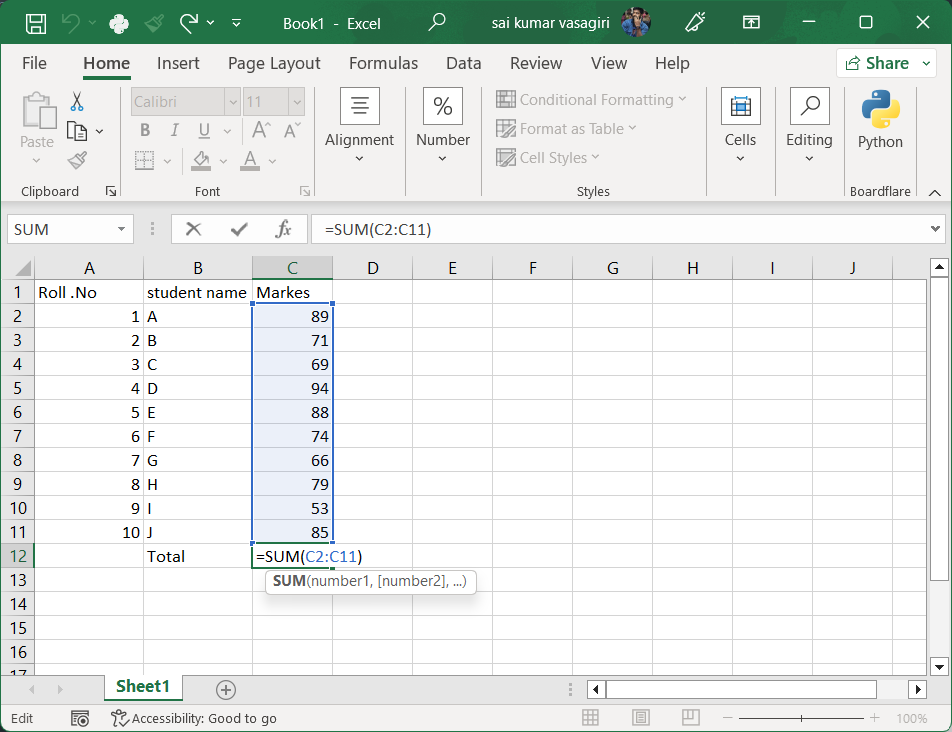
1. Formulas and Functions
Excel has a wide range of built-in functions that can be used to perform calculations on data. Some common functions include:
- SUM: Adds a range of numbers.
- AVERAGE: Calculates the average of a range of numbers.
- COUNT: Counts the number of cells that contain numbers.
- IF: Performs a logical test and returns one value for TRUE and another for FALSE.
- VLOOKUP: Searches for a value in the first column of a table and returns a value in the same row from another column.
- HLOOKUPSearches for a value in the first row of a table and returns a value in the same column from another row.
- INDEX: Returns a value from a specified row and column in a range.
- MATCH: Returns the relative position of an item in a range that matches a specified value.
To use a formula, simply type an equal sign (=) followed by the formula or function name and its arguments. For example:
=SUM(C2:C11) adds the values in cells C2 through C11.
2. Charts and Graphs
Excel allows users to create various types of charts and graphs to visualize data. Some common chart types include:
- Bar Chart: Displays data using rectangular bars.
- Line Chart: Shows trends over time using lines.
- Pie Chart: Represents data as slices of a pie.
- Scatter Plot: Displays values for two variables as points on a graph.
.png)
To create a chart, select the data you want to visualize, go to the Insert tab, and choose the desired chart type. Excel will automatically generate the chart based on your selected data.
3. PivotTable
A PivotTable is a powerful tool for summarizing and analyzing large datasets. It allows users to quickly rearrange and filter data to gain insights. To create a PivotTable:
- Select the data range you want to analyze.
- Go to the Insert tab and click on "PivotTable."
- Choose where you want the PivotTable to be placed (new worksheet or existing worksheet).
- Drag and drop fields into the Rows, Columns, Values, and Filters areas to customize your PivotTable.
.png)
Excel will automatically generate the PivotTable based on your selections, allowing you to analyze and summarize your data easily.
Conclusion
Microsoft Excel is a versatile tool that can help users manage and analyze data effectively. By mastering the basics of Excel, you can unlock its full potential and use it to streamline your work processes. Whether you are creating simple spreadsheets or performing complex data analysis, Excel is an invaluable tool for anyone looking to work with data.
Next Update
In the next update, we will Excel using the data analyst ,explore more advanced features of Microsoft Excel, including data validation, conditional formatting, and advanced charting techniques. Stay tuned!